Why are markets bipolar?
I think most people would agree that the stock market is bipolar - i.e. that sometimes it prices stocks way too high, and sometimes it prices stocks way too low. But yet it’s very hard to make more money than the average in the stock market? How can these two seemingly contradictory statements be true?
It turns out that you have to just make a few simple assumptions and you can build a model with these characteristics: i.e. prices that are impossible to beat systematically, but that seem in retrospect to have been very very wrong.
The following is all adopted from Benoit Mandelbrot’s work. See here for more.
Let’s assume we have a company that has a discounted stream of earnings worth $1. Every day, the earnings can go up by $1, stay flat, or decrease by $1.
Let’s assume that there is some “momentum” to these earnings movements. For every streak of X days the earnings go up, let’s say that the expected value of the number of future days the earnings will go up is also X.
So, let’s say this company starts with $1 worth of future earnings, and the next day they have built that up to $2. Earnings may continue to grow, or fall, but the expected value of future earnings is now $3. This expected value is the price of the claim on the earnings, or in other words, the price of the stock.
There are lots of reasons an increase in earnings would portend a further increase in earnings: the company has more to invest in sales, marketing, or equipment, or could buy back stock (increasing the earnings per share).
If this is true, we’d then expect prices for future earnings to rise (and fall!) much faster than the actual earnings streams themselves. What this looks like, in graphical form, is this:
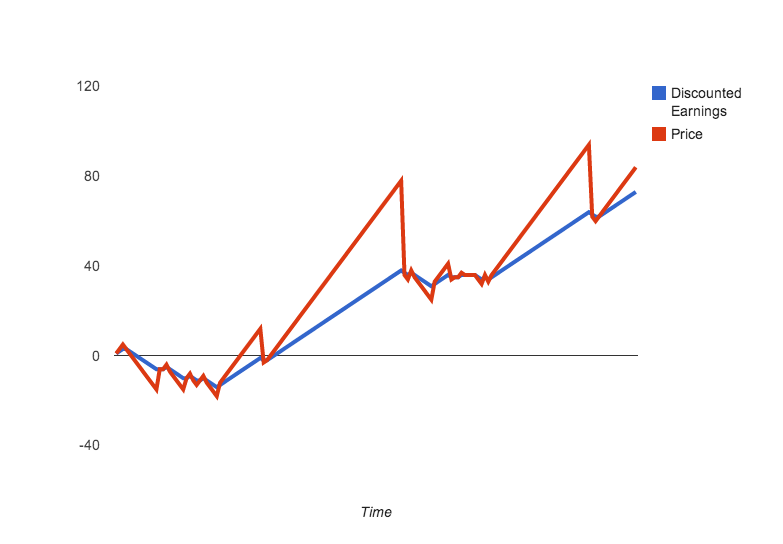
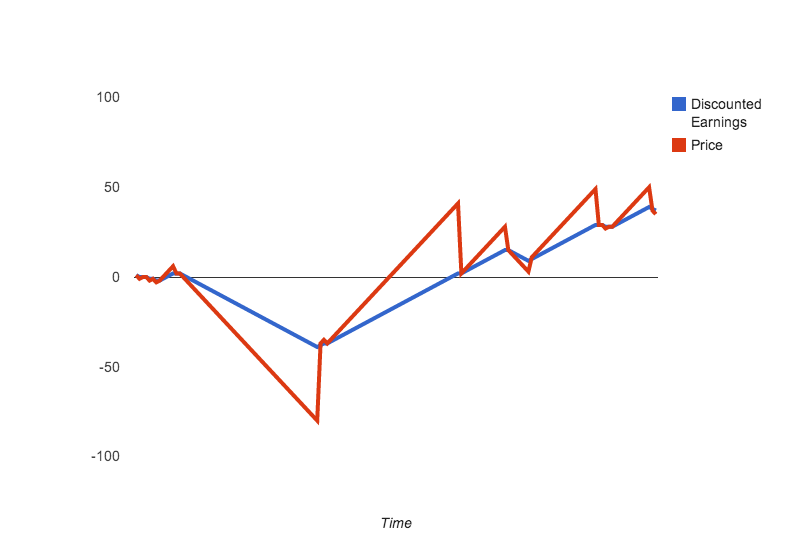 You can see the spreadsheet I used to put this together here [there is not much in the way of detailing the math, but if you’re interested, comment below and I’ll walk you through it].
Now, this is not a complete model by any stretch. It’s just an illustration of how prices can always be “right” in that they represent the current best guess about the value of a stream of earnings, and then appear wildly wrong a short moment later.